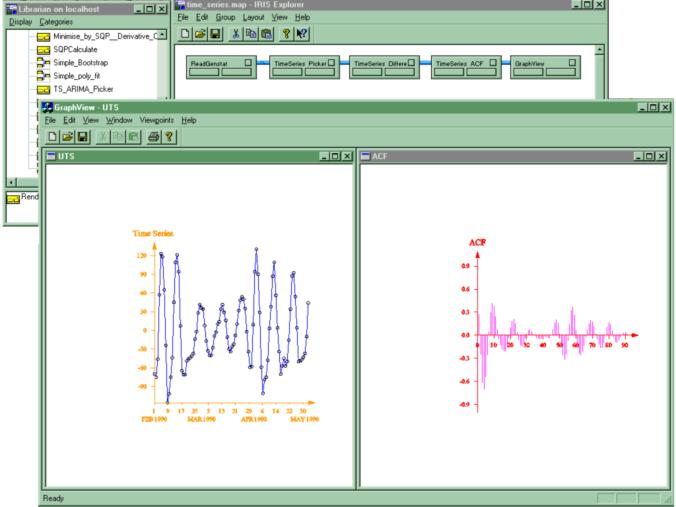
Figure 2. Sunspot data as a function of time is read in from a Genstat data file and plotted in the left-hand window of the GraphView module. Other modules take this time series and determine its autocorrelation function in order to investigate regular patterns in the data. This function is plotted in the right-hand GraphView window. There is no limit on the number of windows that GraphView can manage. Each window is independently resizable and locatable, or GraphView can be asked to tile or cascade them via options on its Window menu. Finally, clicking on any part of a plot (such as the axes) brings up a dialog box which allows the user to dynamically edit its properties such as colour and labelling.